Overview
The Provenance Dashboard — your command center for provenance tracking, analytics, and monitoring.
The Provenance Dashboard is a full-featured web application for managing your provenance data. It provides visual tools for everything from recording interactions to building analytics dashboards and configuring alert pipelines.
Accessing the dashboard
From the platform dashboard, click Provenance UI in the sidebar. This opens the management dashboard in a new tab with a secure session token.
Layout
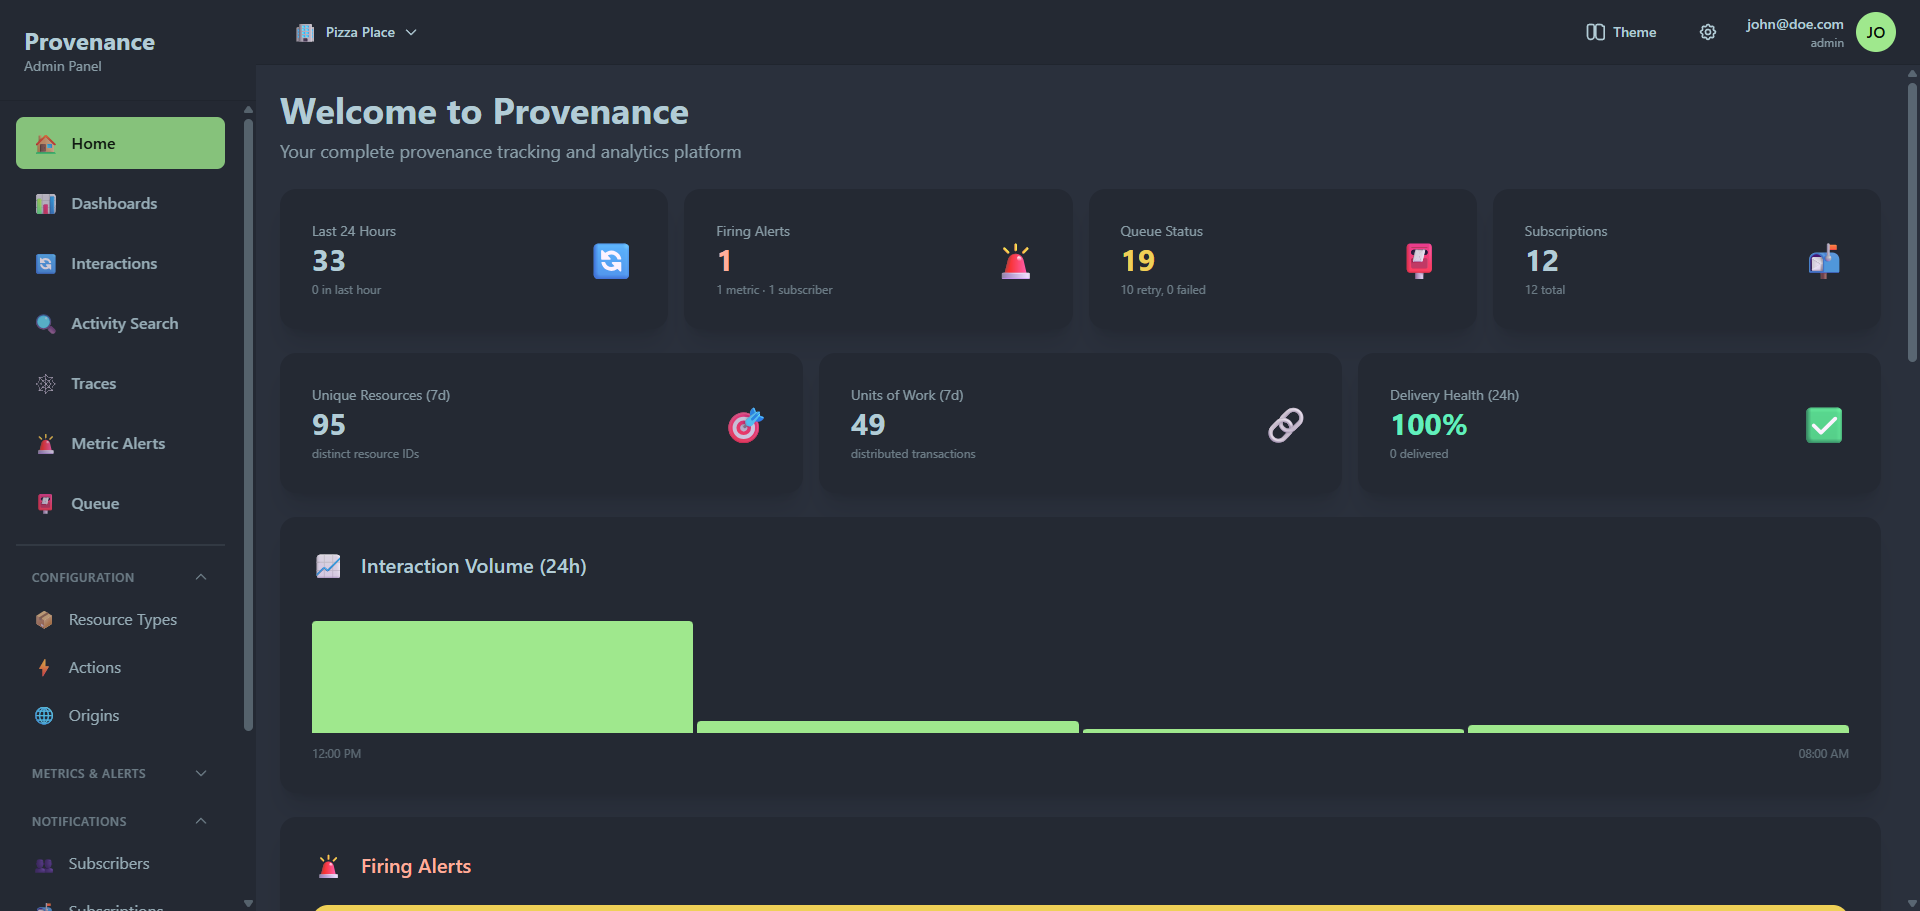
The dashboard has three main areas:
- Sidebar — collapsible navigation organized into groups. Each group can be expanded or collapsed by clicking its header.
- Top toolbar — tenant selector (if you belong to multiple tenants), theme picker, settings menu, and user profile.
- Main content — the active page.
Navigation
Sidebar — top level
These pages appear at the top of the sidebar, above the group divider:
| Icon | Page | Description |
|---|---|---|
| 🏠 | Home | Overview dashboard with key metrics, recent interactions, firing alerts, and quick actions |
| 📊 | Dashboards | Custom analytics dashboards with drag-and-drop widgets |
| 🔄 | Interactions | Browse and filter all recorded interactions |
| 🔍 | Activity Search | Advanced search with JSON path filtering and result grouping |
| 🕸️ | Traces | Visualize interaction flows by Unit of Work ID |
| 🚨 | Metric Alerts | Threshold-based alerts on interaction metrics |
| 📮 | Queue | Notification queue monitoring and management |
Sidebar — Configuration group
| Icon | Page | Description |
|---|---|---|
| 📦 | Resource Types | Define categories of resources being tracked |
| ⚡ | Actions | Define operations that can be performed |
| 🌐 | Origins | Register source systems and services |
Sidebar — Metrics & Alerts group
| Icon | Page | Description |
|---|---|---|
| 📈 | Interaction Metrics | Define reusable metrics on interaction data |
| ⚠️ | Subscriber Alerts | Alerts tied to notification subscriber health |
Sidebar — Notifications group
| Icon | Page | Description |
|---|---|---|
| 👥 | Subscribers | Browse and configure notification adapters (marketplace view) |
| 📬 | Subscriptions | Map events to notification subscribers |
Sidebar — Advanced group
| Icon | Page | Description |
|---|---|---|
| ⚙️ | Custom Functions | User-defined data transformation functions |
| 📚 | Documentation | Integrated API documentation viewer |
Sidebar — Access Control group (self-hosted only)
These pages only appear when running in self-hosted mode (not in multi-tenant SaaS mode, where the platform manages users):
| Icon | Page | Description |
|---|---|---|
| 👤 | Users | User management with Firebase integration |
| 🔐 | Roles | Role management with permission bitmasks |
Settings menu (gear icon in toolbar)
The gear icon in the top toolbar opens a dropdown with:
| Page | Description |
|---|---|
| User Management | Manage users (self-hosted only) |
| Role Management | Manage roles (self-hosted only) |
| Adapter Settings | Global credentials for notification adapters |
| Global Settings | Reusable configuration values for templates |
| Secrets | Secure credential storage |
User menu
Click your email/avatar in the top-right corner to access:
- Your email and current role
- Logout button
Tenant switching
If your account belongs to multiple tenants, a tenant selector dropdown appears in the top-left of the toolbar. It shows:
- Each tenant name
- Your role in that tenant (as a badge)
- The currently active tenant (highlighted)
Clicking a different tenant reloads the dashboard with that tenant's data.
Themes
Click the Theme button in the top toolbar to switch between dark themes:
- Dracula — purple-accented dark theme
- Night — deep blue dark theme
- Business — muted professional dark theme
- Dim — softer dark theme
The selected theme persists across sessions.
Permissions
Access to pages and actions is controlled by role-based permissions. Each navigation item has a permission requirement (module + permission pair). If your role doesn't have the required permission, the page won't appear in the sidebar.
Permission modules include:
CONFIG— resource types, actions, originsINTERACT— interactions, activity, tracesANALYTICS— dashboards, widgetsALERTS— metrics, alerts, queue, subscribers, subscriptionsSYSTEM— custom functions, user management, role management