Metrics & Alerts
Define interaction metrics and create threshold-based alerts.
The metrics and alerting system lets you define reusable metrics on your interaction data and create alerts that fire when those metrics cross thresholds.
Interaction metrics
Interaction Metrics are reusable metric definitions that aggregate your interaction data. They serve as the foundation for metric alerts.
Creating a metric
Click + New Metric to open a 4-step wizard.
Step 1: Basic info
| Field | Required | Description |
|---|---|---|
| Metric Name | Yes | Human-readable name (e.g. "Failed Logins (5m)") |
| Description | No | What this metric measures |
| Resource Type | No | Scope to a specific resource type, or leave blank for all |
| Action | No | Scope to a specific action, or leave blank for all |
| Origin | No | Scope to a specific origin, or leave blank for all |
| Time Window | Yes | Aggregation window: 5m, 15m, 1h, 6h, 24h, 7d, 30d, or All Time |
Step 2: Metric type
Select the aggregation type:
- Count — number of matching interactions
- Sum — sum of a numeric field
- Average — average of a numeric field
- Min / Max — minimum or maximum of a numeric field
- Unique Count — count of distinct values
For Sum, Average, Min, Max, and Unique Count, you must specify the field to aggregate. If you selected a resource type and action in Step 1, the field dropdown is populated with actual fields discovered from your interaction data.
Step 3: Filters
Optional additional filter conditions on interaction fields. Each filter has a field, operator (equals, not equals, contains, greater than, less than), and value.
Step 4: Grouping
Optional group-by dimensions. For example, grouping a "Failed Logins" metric by userId gives you per-user failure counts. Up to 5 dimensions.
Calculating metrics
- Click Calculate on any metric to compute its current value.
- Click Calculate All to compute all metrics at once.
Results show in a summary table with metric name, type, result count, and a sample value. Click View All to see the full breakdown.
Metric alerts
Metric Alerts trigger when a metric's value crosses a threshold. They create provenance interactions on state changes (firing and recovery), which can in turn trigger notification subscriptions.
Editing an alert
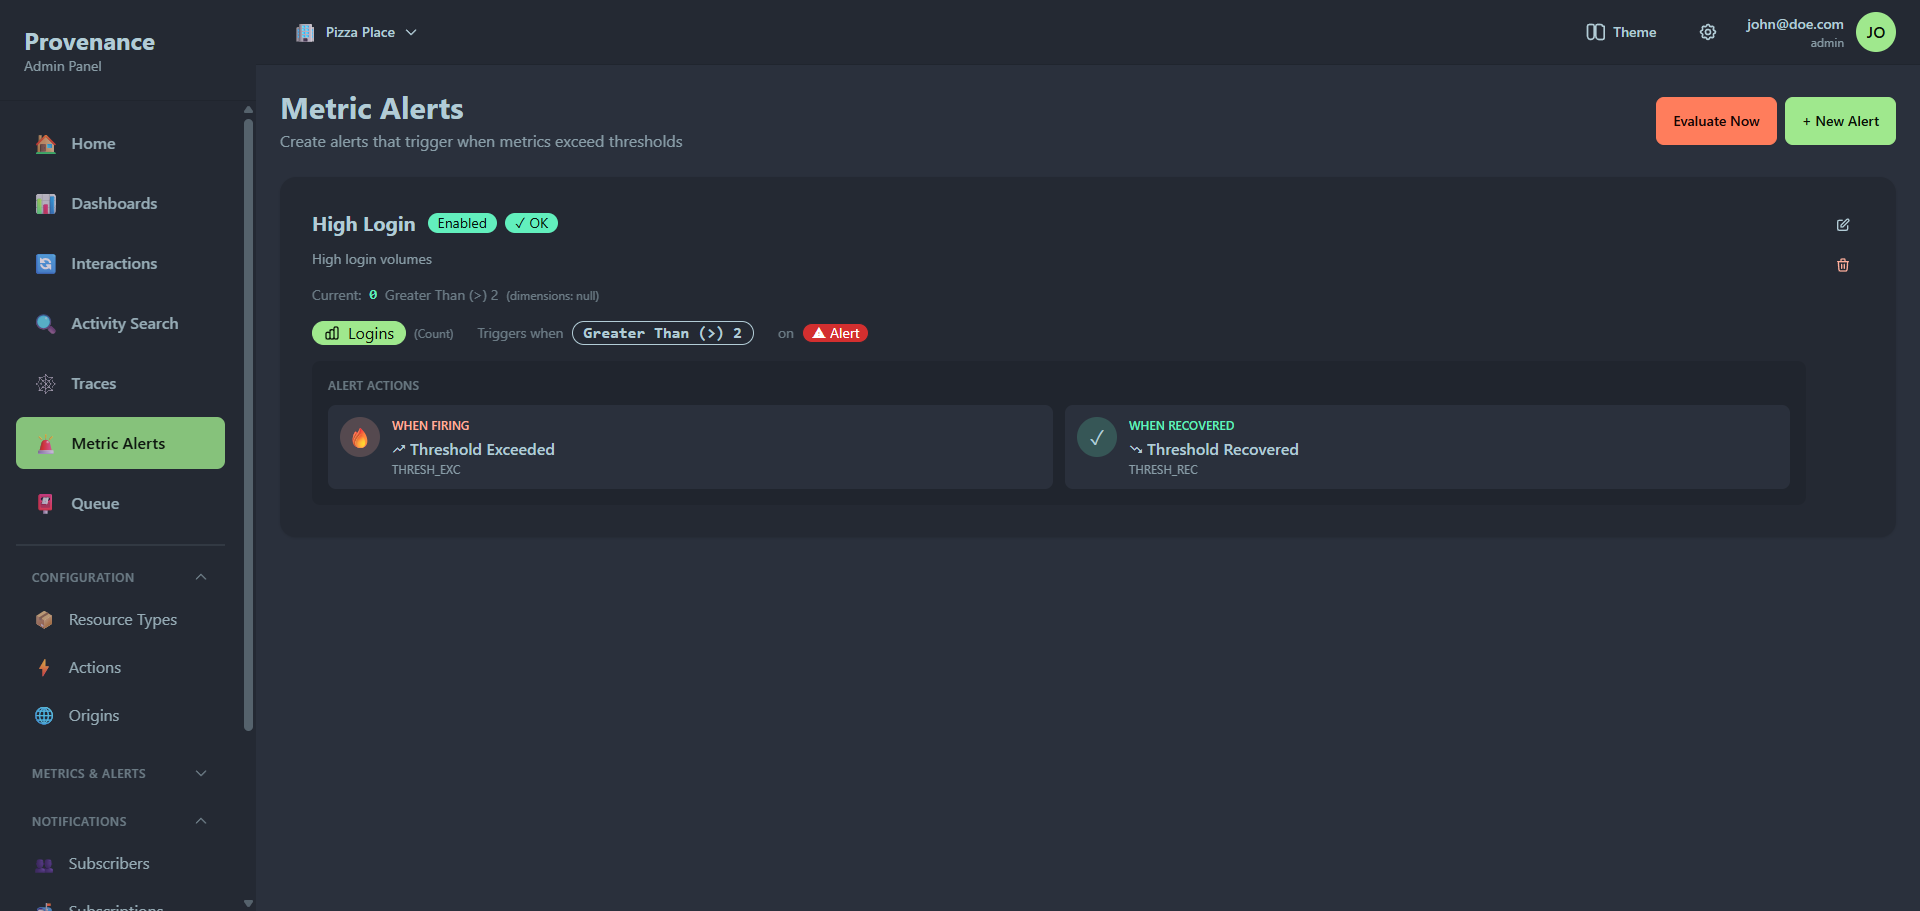
Alert card
Each alert card shows:
- Title and description
- Status badges — Enabled/Disabled and OK/FIRING (with pulse animation on state change)
- Current value vs threshold (color-coded: red when firing, green when OK)
- Metric badge — which metric this alert monitors
- Condition — operator and threshold (e.g. "> 100")
- Resource type — optional scope
- Alert actions — what happens when the alert fires and recovers
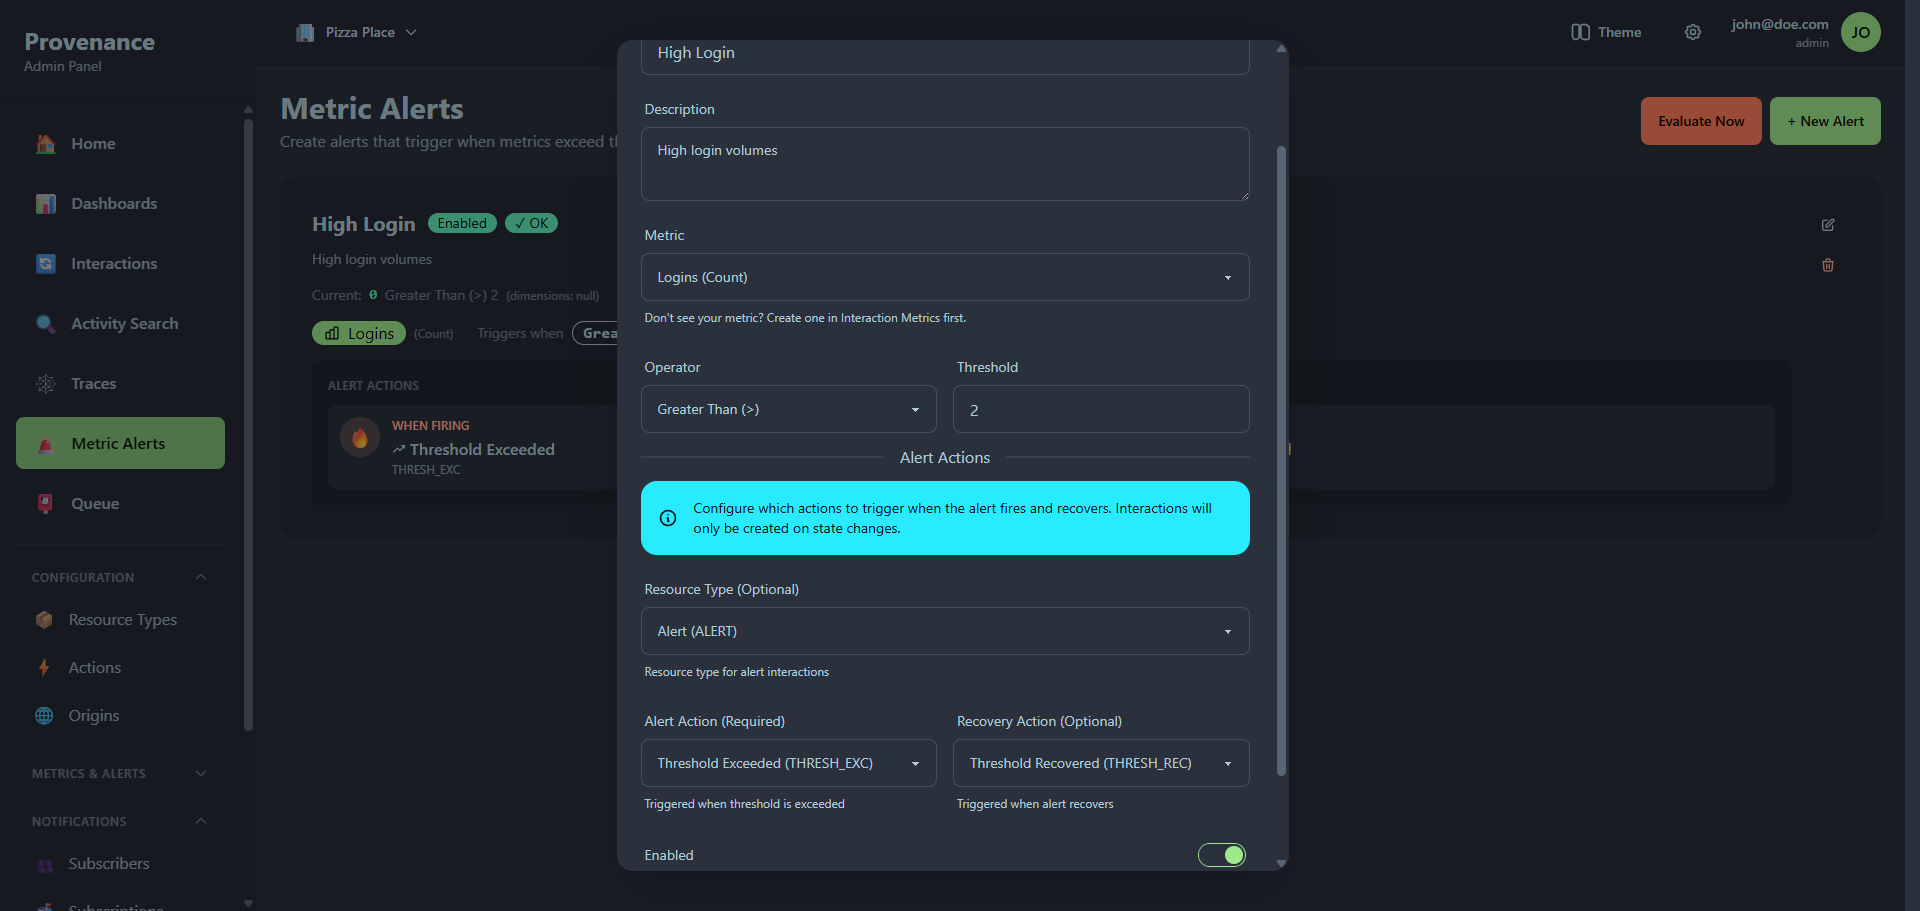
Creating an alert
Click + New Alert to open the creation modal.
| Field | Required | Description |
|---|---|---|
| Alert Name | Yes | Human-readable name |
| Description | No | What this alert monitors |
| Metric | Yes | Select from your defined metrics |
| Operator | Yes | >, >=, <, <=, =, ≠ |
| Threshold | Yes | Numeric threshold value |
| Resource Type | No | Resource type for the alert interaction (defaults to ALERT) |
| Alert Action | Yes | Action to trigger when the alert fires |
| Recovery Action | No | Action to trigger when the alert recovers |
| Enabled | Yes | Toggle the alert on/off |
How alert actions work
When a metric alert fires, it creates a provenance interaction with:
- The configured resource type and alert action
- The metric name, current value, and threshold in the interaction data
This interaction can trigger notification subscriptions — so you can get a Slack message, email, or webhook when an alert fires.
Recovery works the same way: when the metric drops back below the threshold, a recovery interaction is created.
Interactions are only created on state changes — not on every evaluation.
Evaluating alerts
Click Evaluate Now to manually check all alerts against current metric values. The result shows how many alerts were evaluated, how many fired, and how many recovered.
Subscriber alerts
Subscriber Alerts (under Metrics & Alerts → Subscriber Alerts) monitor the health of notification subscribers. They track metrics like failure rate, delivery latency, and queue depth per subscriber.