Home
The home dashboard — a real-time overview of your provenance system.
The Home page is the first thing you see when you open the dashboard. It provides a live overview of your entire provenance system at a glance.
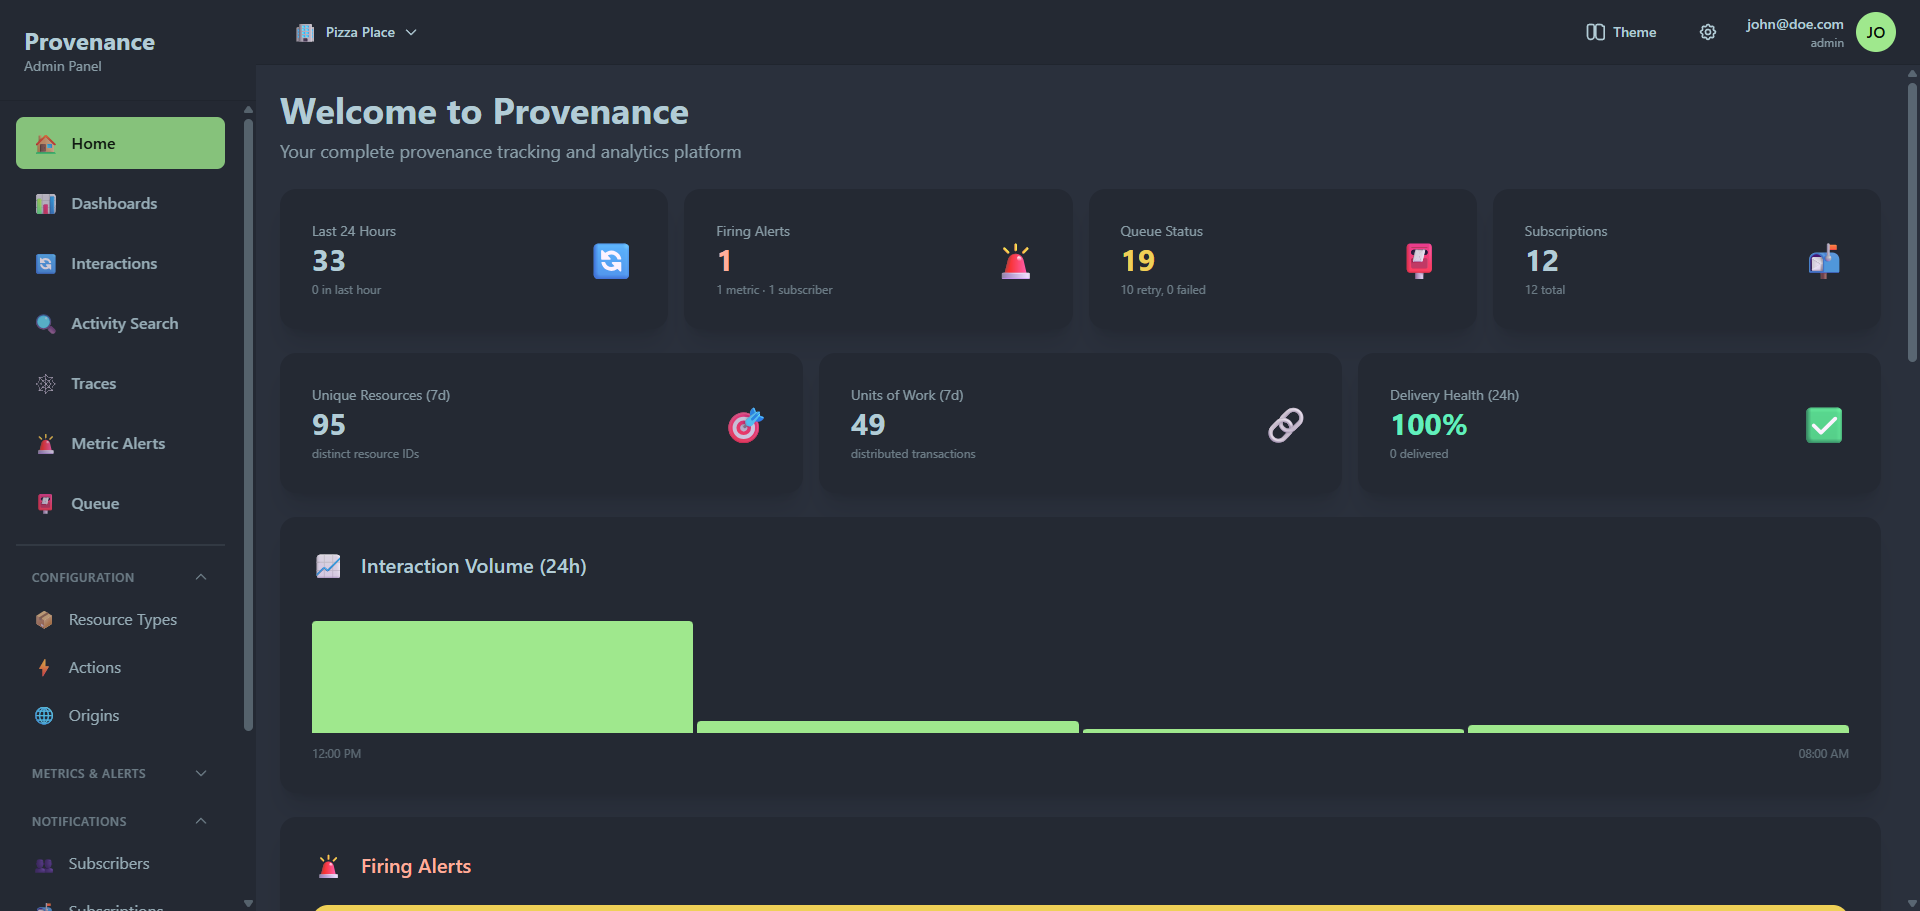
Key metrics
The top row shows four primary metrics, each clickable to navigate to the relevant page:
| Card | Shows | Links to |
|---|---|---|
| Last 24 Hours | Interaction count in the last 24h (and last hour) | Interactions |
| Firing Alerts | Count of currently firing metric + subscriber alerts | Metric Alerts |
| Queue Status | Pending notifications (retry and failed counts) | Queue |
| Subscriptions | Active subscriptions out of total | Subscriptions |
The second row shows:
| Card | Shows | Links to |
|---|---|---|
| Unique Resources (7d) | Distinct resource IDs in the last 7 days | Activity Search |
| Units of Work (7d) | Distinct UOW IDs (distributed transactions) | Traces |
| Delivery Health (24h) | Percentage of successfully delivered notifications | Queue |
Hourly trend
A 24-hour bar chart shows interaction volume by hour. Hover over any bar to see the exact count and time.
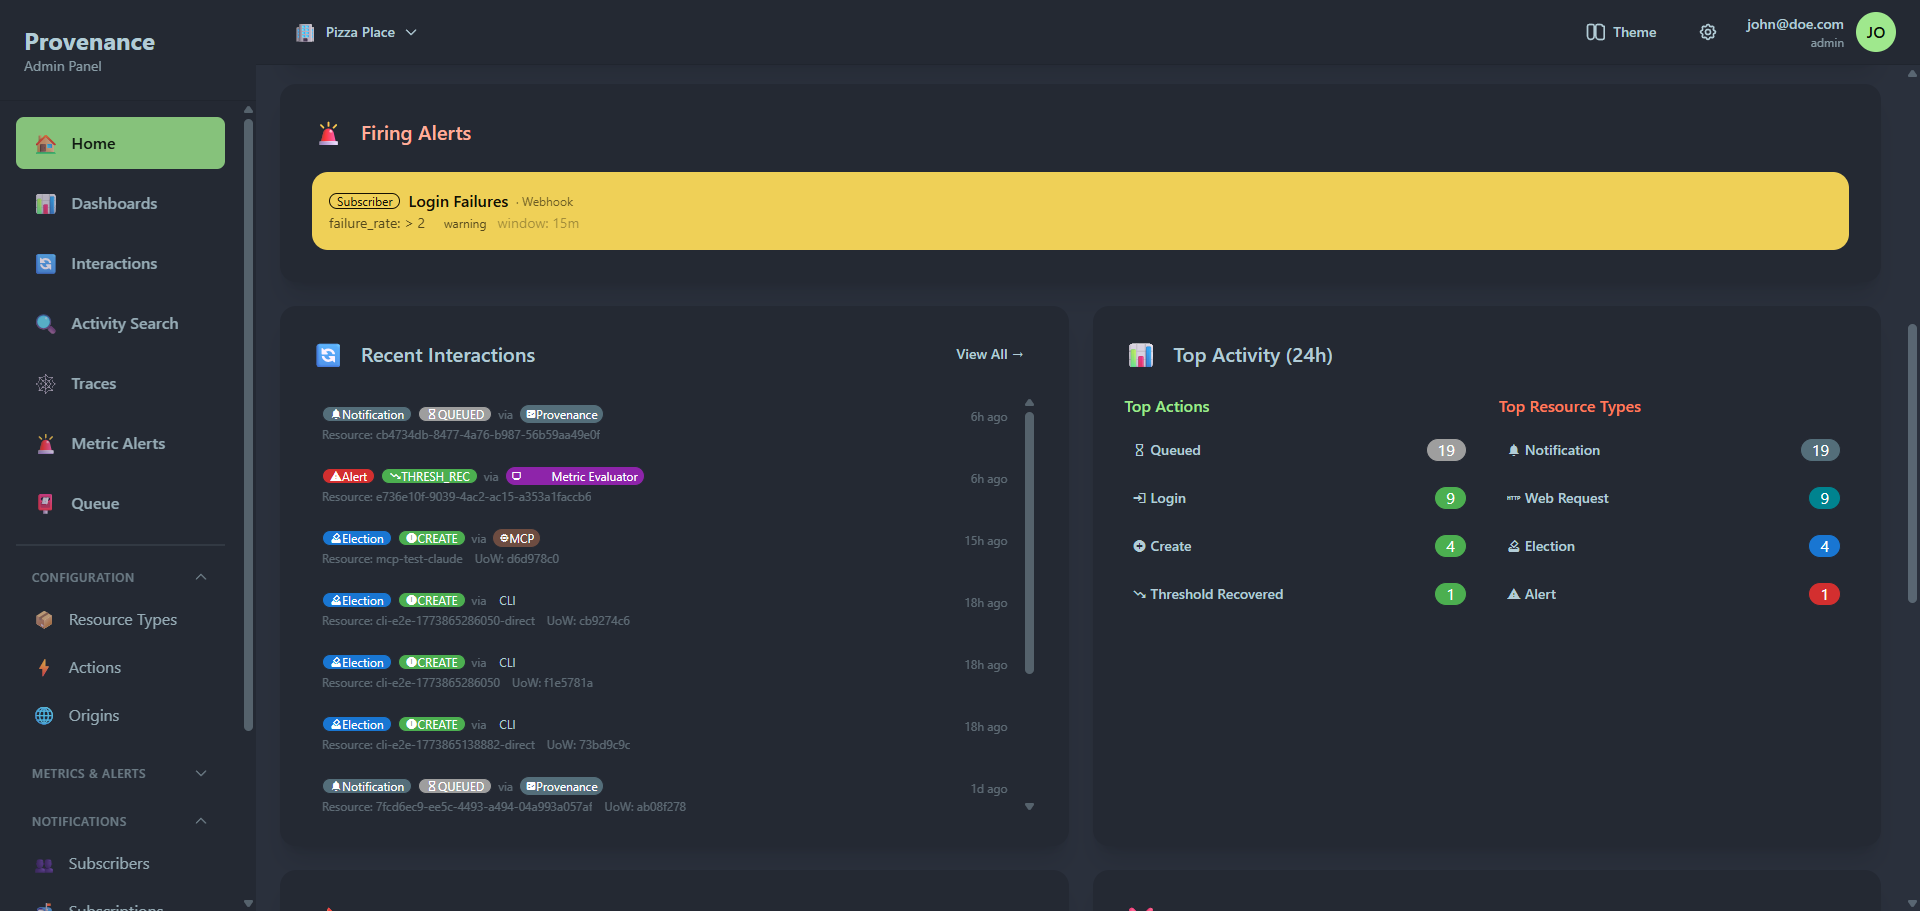
Firing alerts
If any metric or subscriber alerts are currently firing, they appear in a prominent red section. Each alert shows:
- Alert type badge (Metric or Subscriber)
- Alert name and resource type
- Current metric value vs threshold
- When it last triggered
Clicking an alert navigates to the relevant alerts page.
Recent interactions
A scrollable list of the most recent interactions, showing:
- Resource type badge (with custom colors and icons)
- Action badge
- Origin badge
- Resource ID and UOW ID
- Relative timestamp
Click any interaction to navigate to its detail view.
Top activity (24h)
A two-column breakdown of the most active actions and resource types in the last 24 hours, with counts. Click any item to search for those interactions in Activity Search.
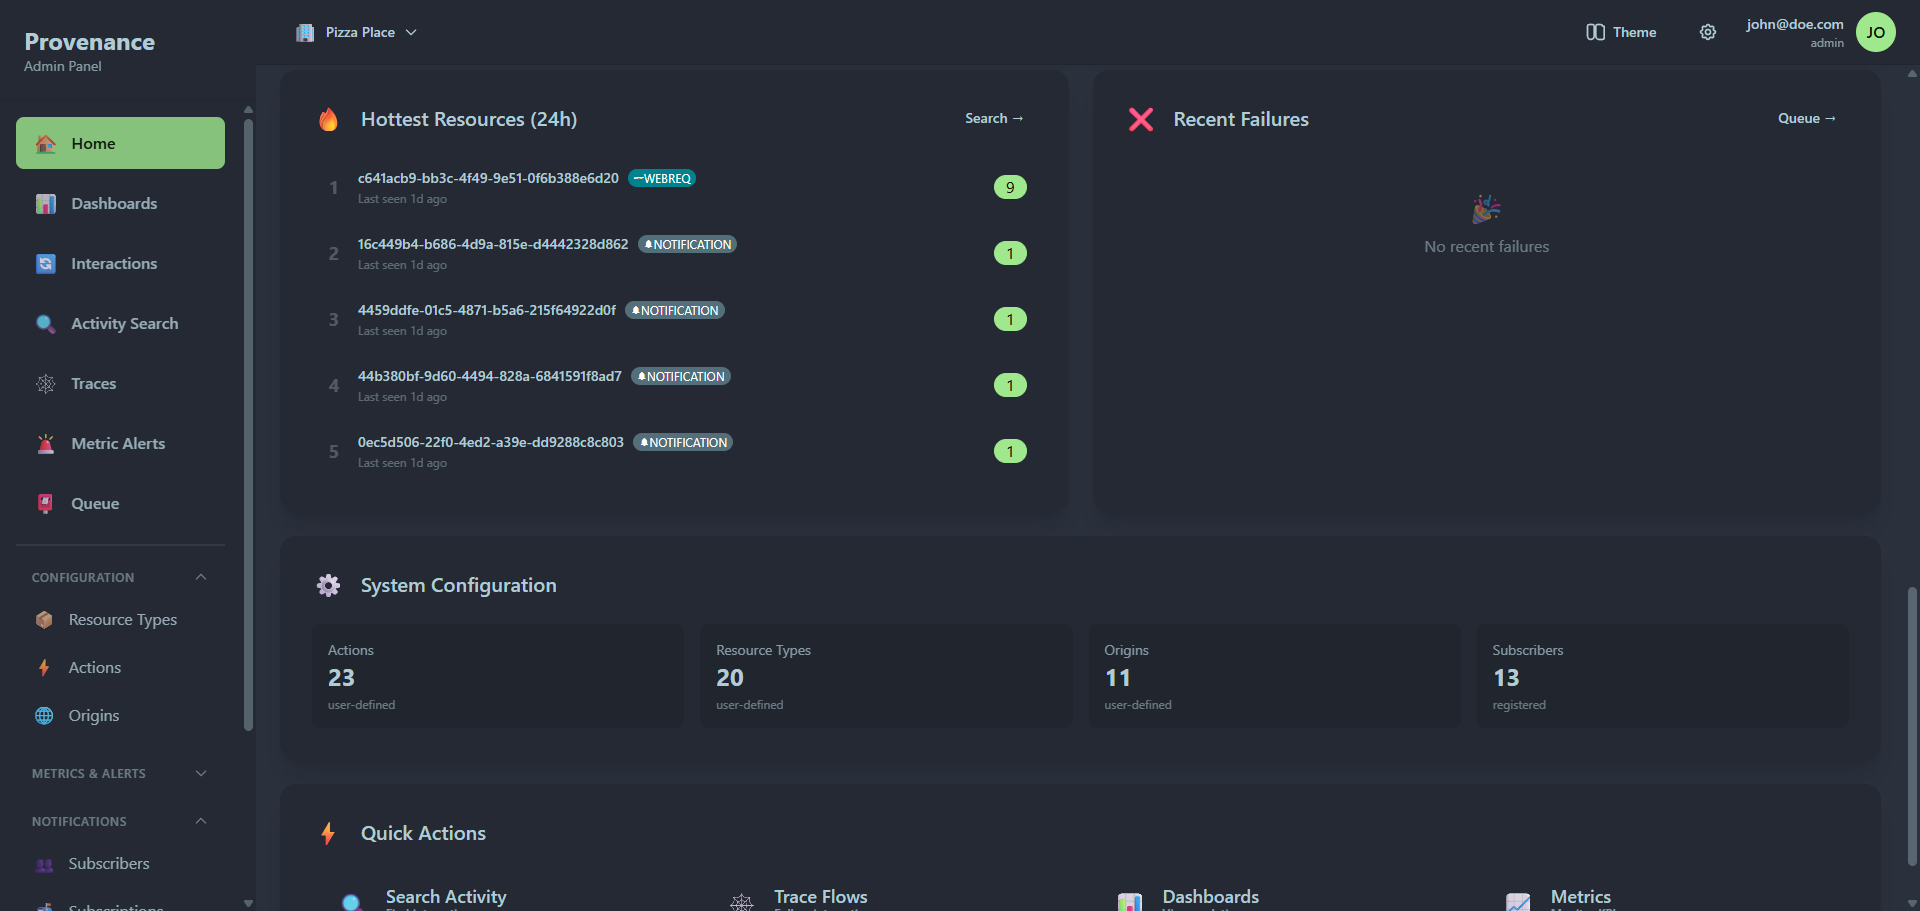
Hottest resources (24h)
A ranked list of the most active resource IDs, showing interaction count, resource type, and last seen time. Click any resource to view its trace.
Recent failures
The latest notification delivery failures, showing subscriber name, resource type, action, error message, and attempt count. Click to navigate to the Queue page.
System configuration
A quick summary of how many actions, resource types, origins, and subscribers are configured. Each card is clickable.
Quick actions
Four shortcut buttons for common tasks:
- Search Activity — open Activity Search
- Trace Flows — open Traces
- Dashboards — open Dashboards
- Metrics — open Interaction Metrics