Traces
Visualize interaction flows across systems using Unit of Work IDs.
The Trace Viewer lets you follow a chain of related interactions across multiple systems by entering a Unit of Work (UOW) ID. This is essential for debugging distributed transactions and understanding how a single operation flows through your architecture.
Loading a trace
Enter a UOW ID in the input field and click Load Trace (or press Enter). The UOW ID is a UUID that correlates all interactions belonging to the same logical operation.
You can also arrive here by:
- Clicking a UOW ID link from the Interactions detail modal
- Clicking a UOW ID on the Home page
- Using the query parameter
?uowId=uuid
The viewer loads two API calls in parallel: the trace summary (/api/traces/:uowId/summary) and the full interaction list (/api/traces/:uowId).
Trace summary
The summary card shows four key metrics:
| Metric | Description |
|---|---|
| Total Interactions | Number of interactions in this trace |
| Unique Resources | Number of distinct resource IDs |
| Duration | Time span from first to last interaction (in seconds) |
| Systems | Number of distinct origins involved |
| Root Interactions | Number of interactions without a parentSpanId (top-level entry points) |
Below the metrics, origin badges show which systems participated in the trace.
Visualization modes
Toggle between two views using the Timeline / Graph buttons.
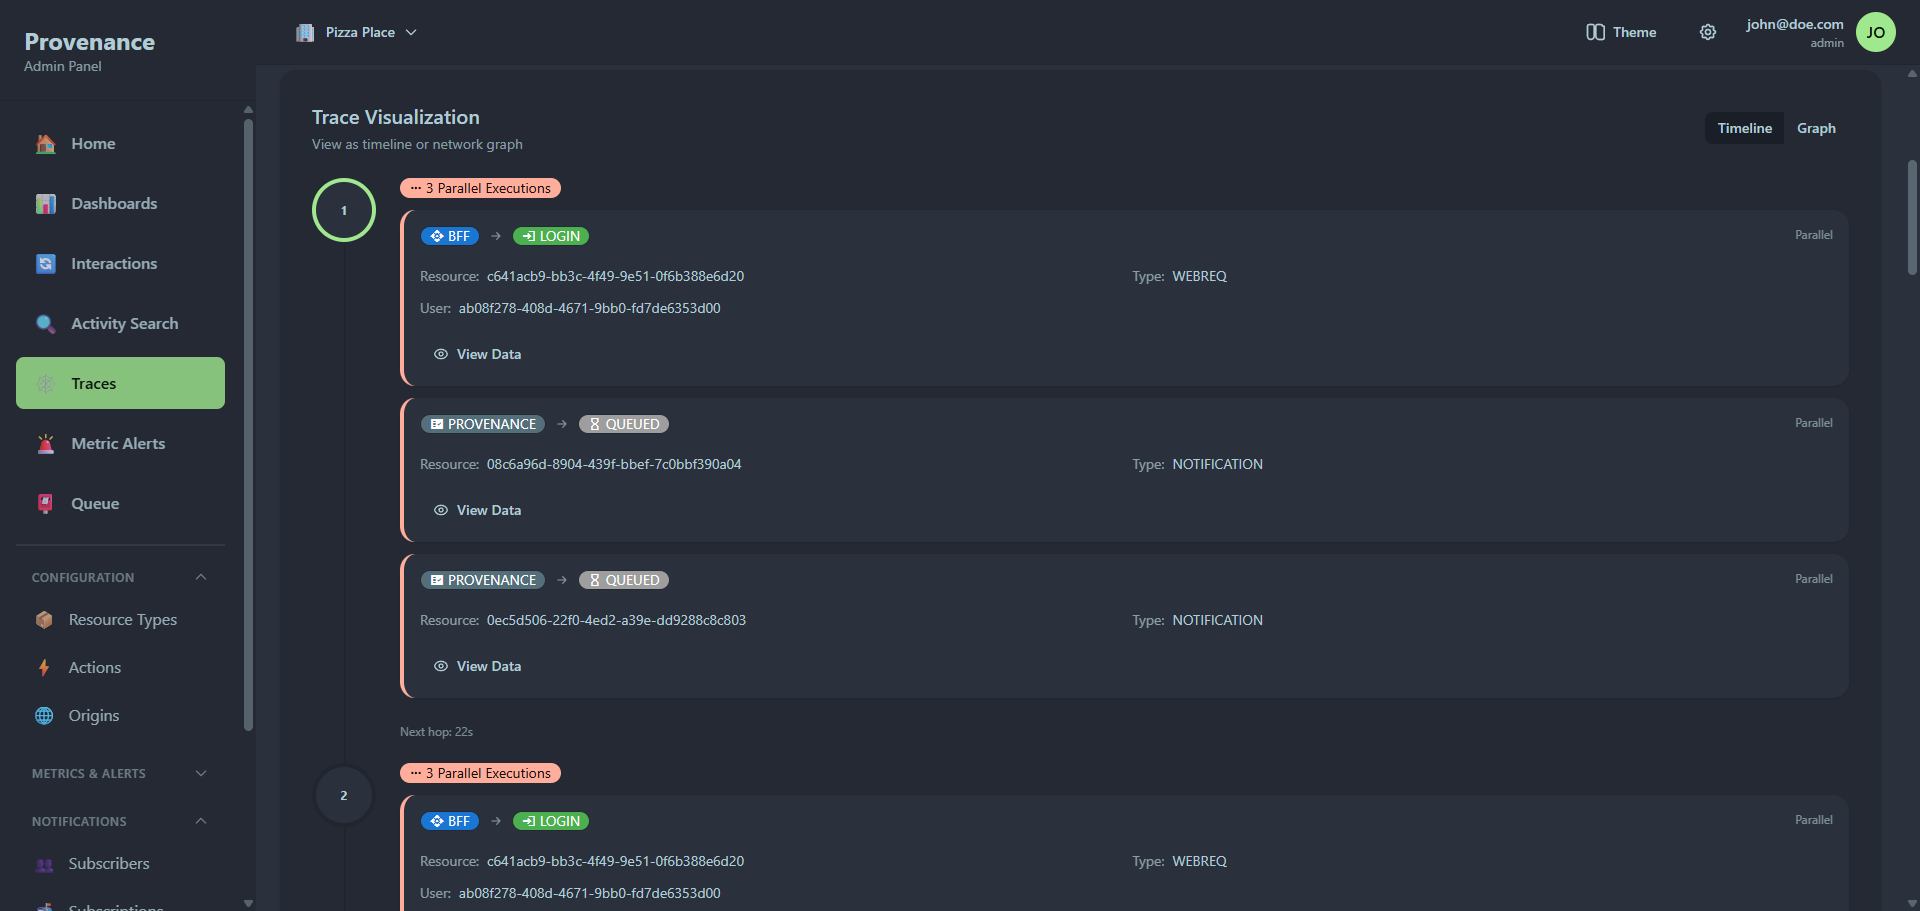
Tree timeline view
When interactions have span hierarchy data (spanId / parentSpanId), the timeline renders as an expandable tree. Root interactions (those without a parentSpanId) appear at the top level, with child interactions nested below. Each node shows an expandable chip with the origin, action, resource, and timestamp.
If no span hierarchy exists, the timeline falls back to a flat chronological list.
Each step shows:
- Step number in a circle — first step has a blue border, last step has a green border, middle steps have a neutral border
- Origin badge → arrow → Action badge — showing the flow direction
- Resource ID and Resource Type
- Timestamp
- View Data button to inspect the full interaction payload
Parallel executions
When multiple interactions share the exact same timestamp, they're grouped together with a red Parallel Executions badge showing the count. Each parallel interaction gets a red left border to visually distinguish it.
Parallel interactions also show additional fields when present:
- User ID
- External Reference
- External Response (rendered as JSON)
Adapter interactions (where the resource ID starts with adapter-) get an additional Adapter badge.
Time between hops
Between each step (or group of parallel steps), the time difference is displayed (e.g. "Next hop: 1.2s", "Next hop: 0s").
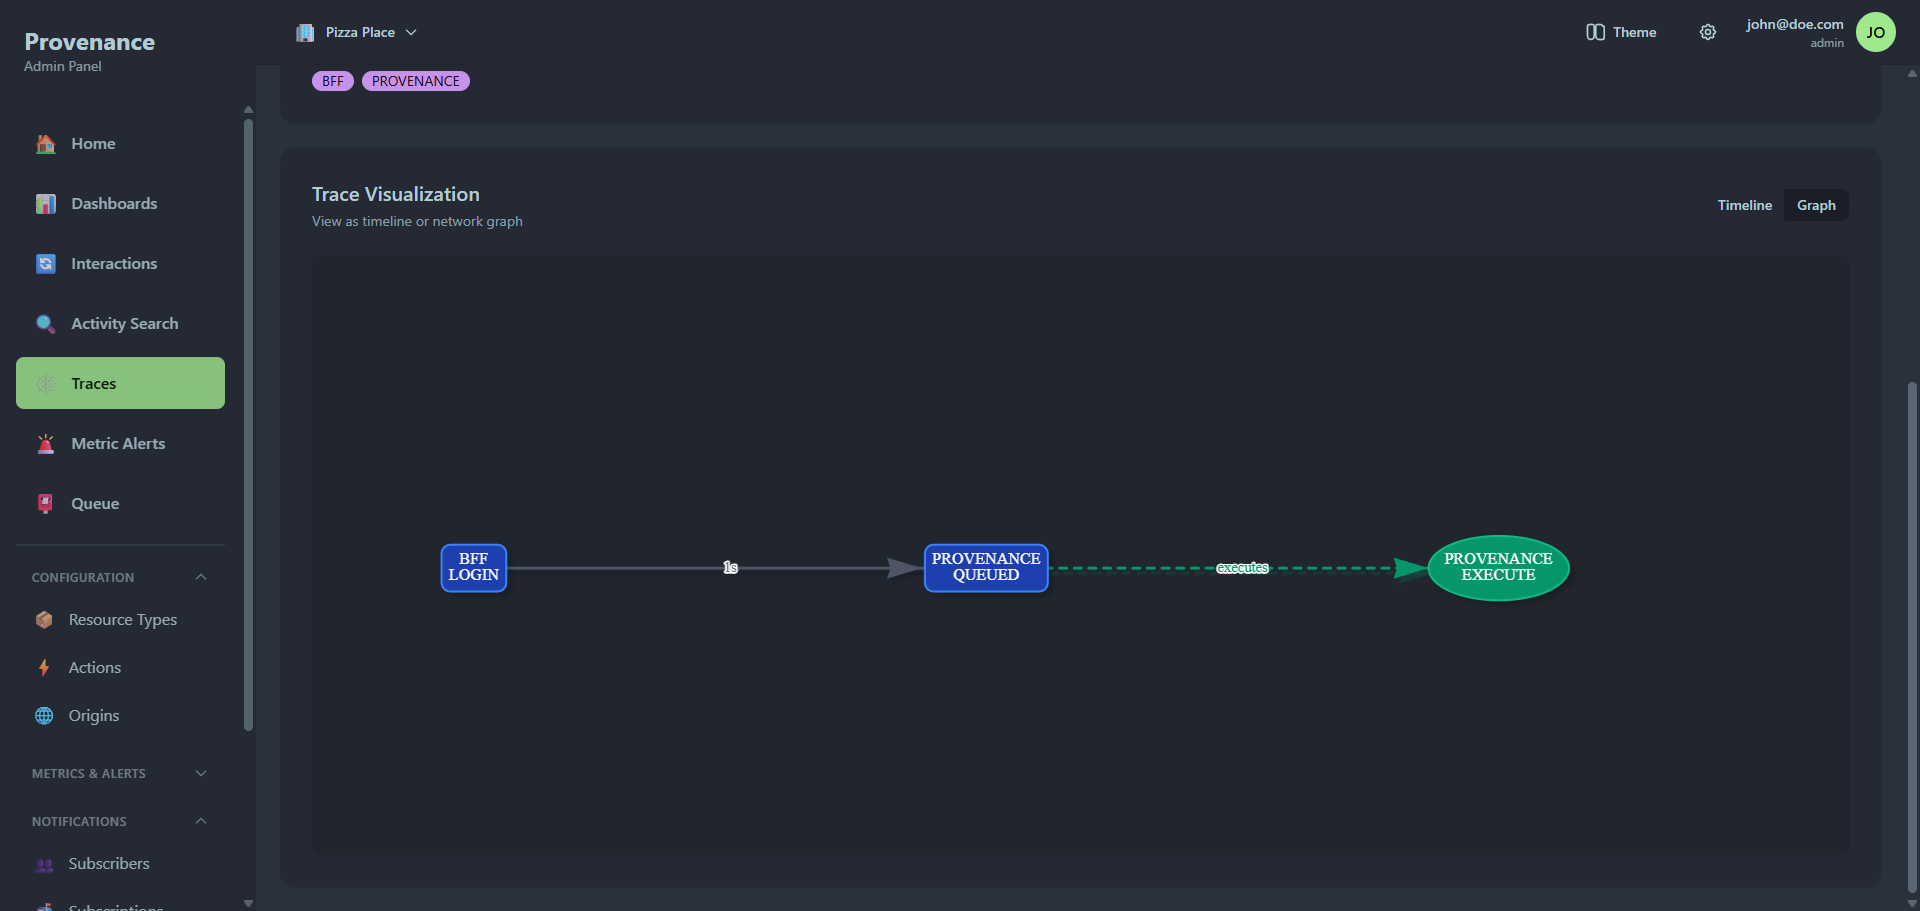
Graph view
An interactive network graph built with foblex showing the relationships between interactions as a directed tree. The graph supports fullscreen mode, zoom controls, and pan navigation.
Controls
- Fullscreen — expand the graph to fill the viewport
- Zoom in/out — use scroll wheel or zoom buttons
- Copy — copy the trace data to clipboard
- Export — download the trace as JSON
Node types
| Node shape | Color | Meaning |
|---|---|---|
| Box (blue) | #1e40af | Standard interaction |
| Box (purple) | #7c3aed | Parallel execution (non-adapter) |
| Ellipse (green) | #059669 | Adapter execution |
| Ellipse (red) | #dc2626 | Parallel adapter execution |
Each node label shows Origin → Action. Hover over a node to see a tooltip with the full timestamp, resource ID, resource type, user ID, and external reference.
Edges
- Standard edges (gray) connect sequential interactions with time labels
- Parallel edges (red, thicker) connect to parallel executions
- Adapter edges (green, dashed) link notification queue items to their adapter executions
Interactions
- Click any node to open the interaction detail modal
- Drag nodes to reposition them
- Scroll to zoom in/out
- Hover over nodes and edges for tooltips
Interaction detail modal
Click View Data on any timeline step (or click a graph node) to open a modal showing:
- Origin and Action badges
- Full timestamp
- External reference (if present)
- Interaction data — the full JSON payload in a code block
- External response — the response JSON (if present)
- Notifications sent — audit records showing subscriber name, delivery status, status code, timestamp, and response details (expandable)