Interactions
Browse, filter, and inspect recorded interactions.
The Interactions page is your primary view into all recorded provenance events. It combines powerful filtering with a detailed inspection modal.
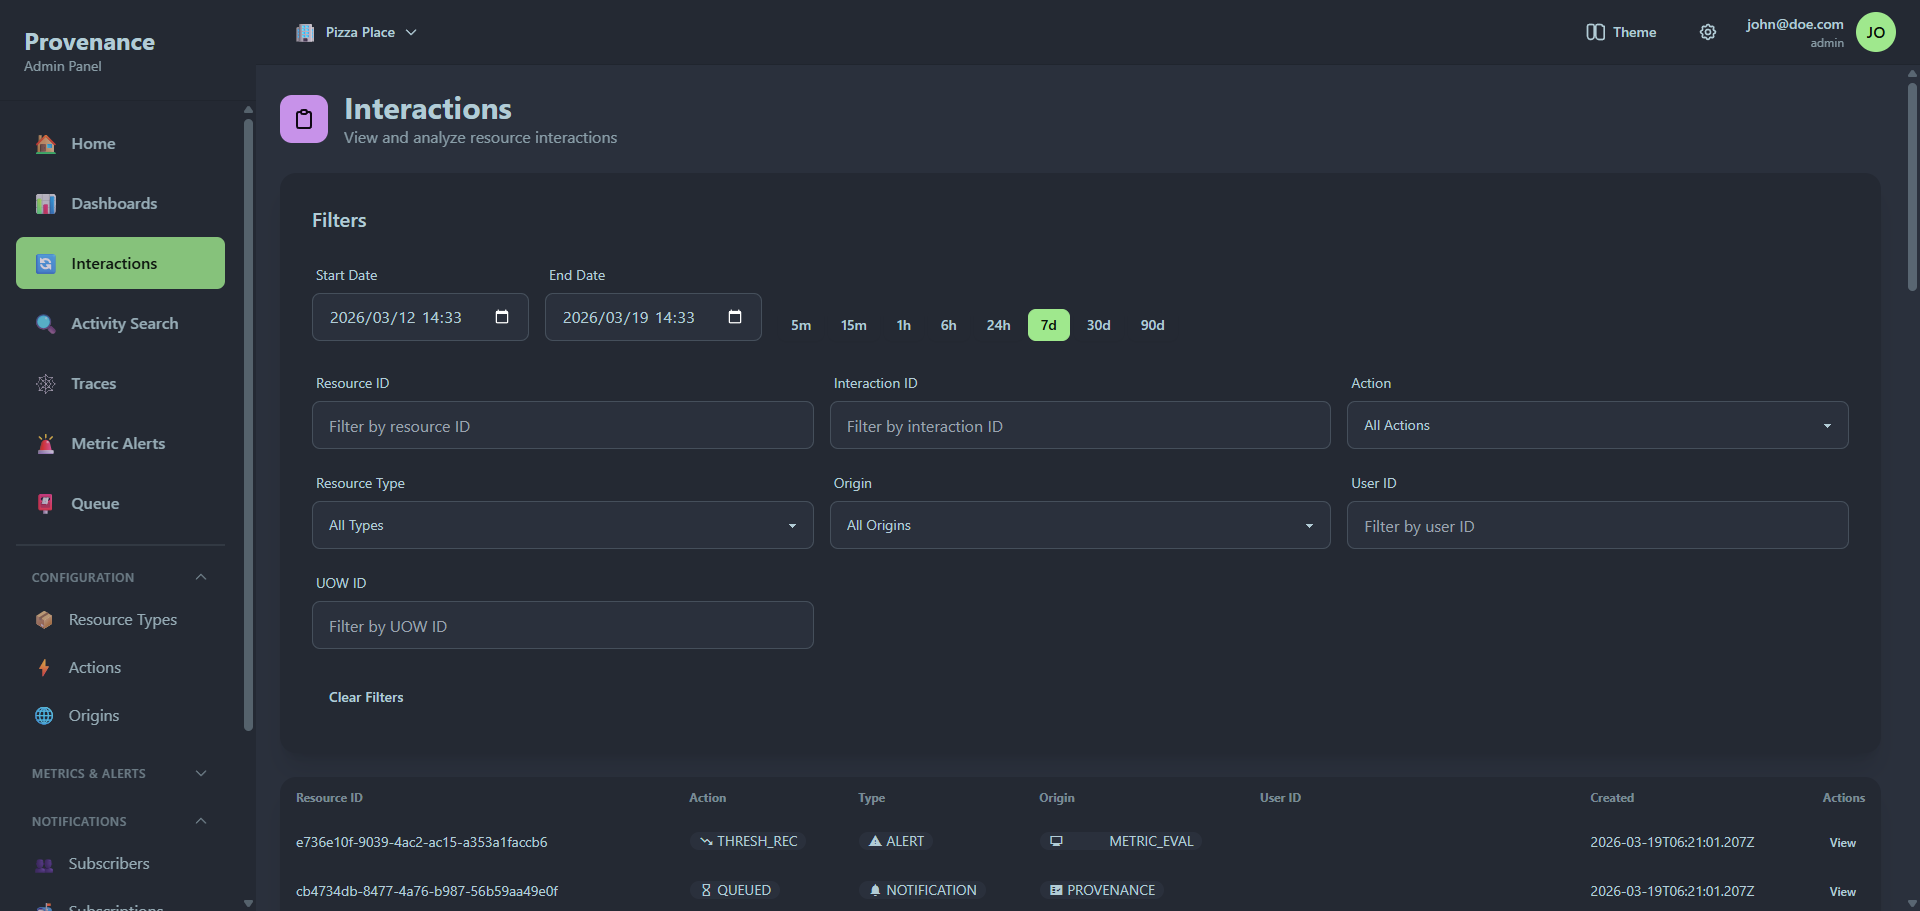
Filtering
The filter panel at the top provides multiple ways to narrow down interactions.
Time range
Quick-select buttons for common time ranges:
5m · 15m · 1h · 6h · 24h · 7d · 30d · 90d
Or use the date-time pickers for a custom range.
Field filters
| Filter | Type | Description |
|---|---|---|
| Resource ID | Text | Exact or partial resource ID match |
| Interaction ID | Text | UUID of a specific interaction |
| Action | Dropdown | Filter by action (populated from your configured actions) |
| Resource Type | Dropdown | Filter by resource type |
| Origin | Dropdown | Filter by origin |
| User ID | Text | Filter by the user who performed the action |
| UOW ID | Text | Filter by Unit of Work ID to find correlated interactions |
Click Clear Filters to reset all filters.
Results table
The data table shows:
| Column | Description |
|---|---|
| Resource ID | The resource that was acted upon |
| Action | Color-coded badge with icon |
| Type | Resource type badge with icon |
| Origin | Origin badge with icon |
| User ID | Who performed the action |
| Created | Timestamp |
Each row has a View button to open the detail modal.
Pagination
Results are paginated. Use the paginator at the bottom to navigate pages or change the page size.
Interaction detail modal
Clicking View opens a full-screen modal with two tabs.
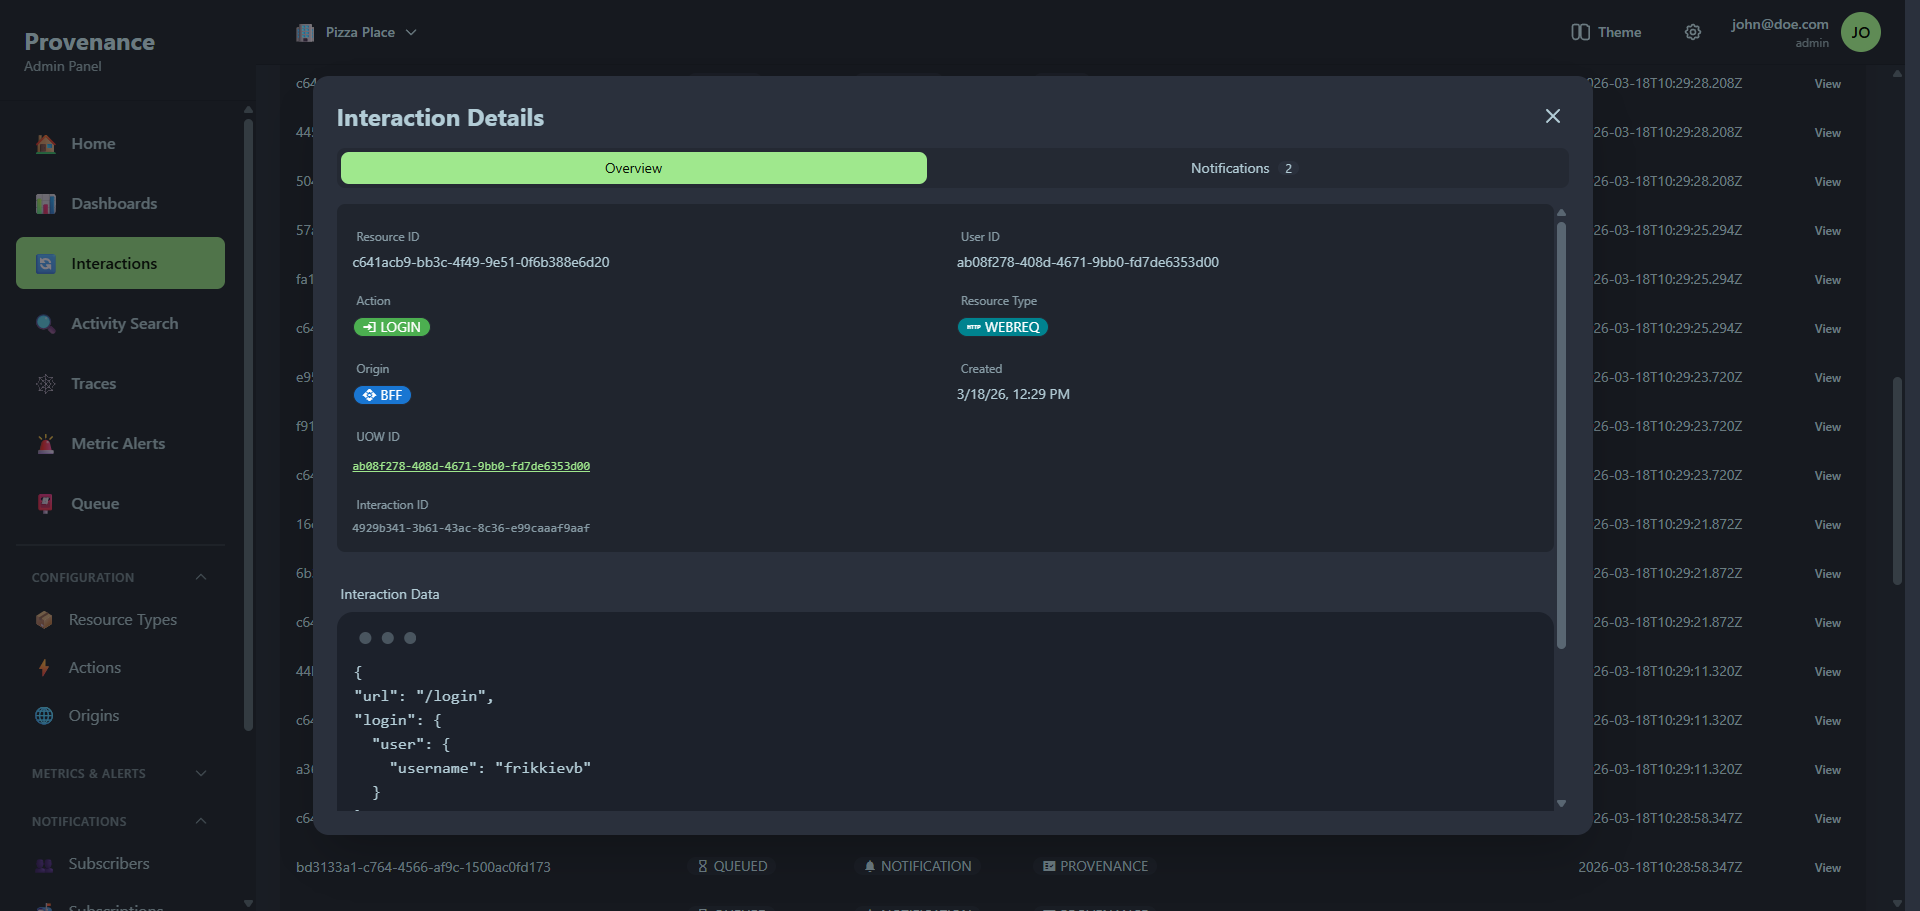
Overview tab
A structured view of the interaction:
- Resource ID and User ID
- Action, Resource Type, and Origin — displayed as color-coded badges
- Created date
- UOW ID — clickable link that navigates to the Trace viewer
- Interaction ID — the unique UUID
- Interaction Data — the full JSON payload in a code block
Notifications tab
Shows all notification queue items triggered by this interaction. The tab badge shows the count.
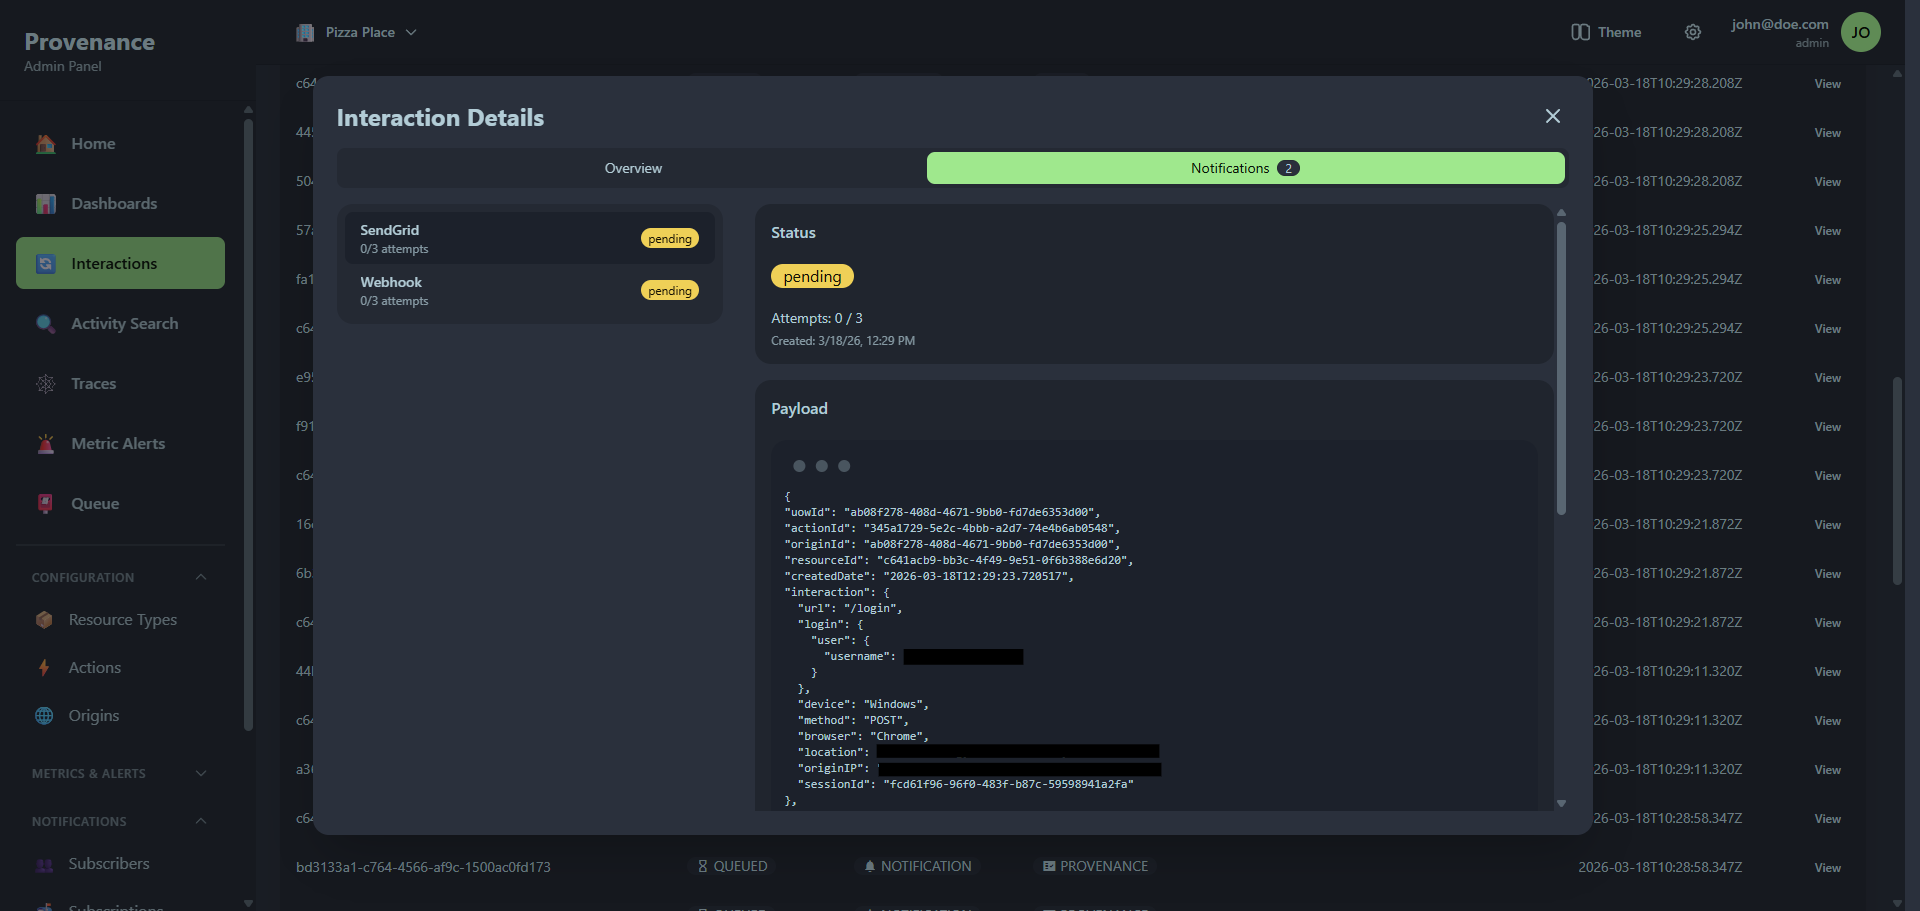
The left panel lists each notification with:
- Subscriber name
- Attempt count (e.g. "2/3 attempts")
- Status badge (pending, retry, completed, failed)
Clicking a notification shows its details in the right panel:
- Status — current status with attempt count and timestamps
- Error — error message if the notification failed
- Payload — the full request payload sent to the subscriber
- Lifecycle Hooks — execution results for any configured hooks, showing function name, success/failure, execution time, and error details